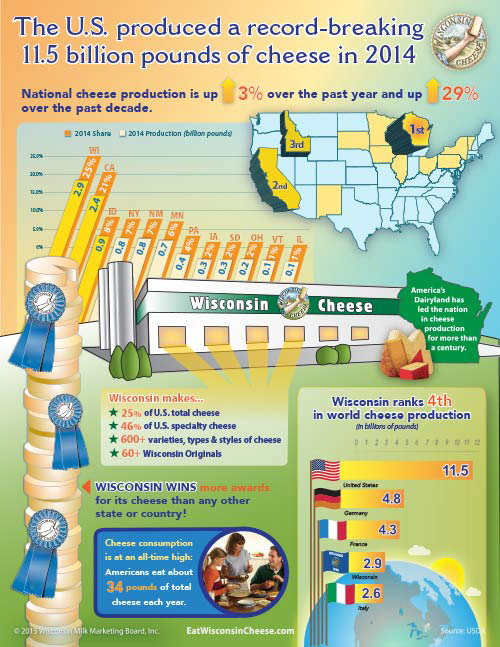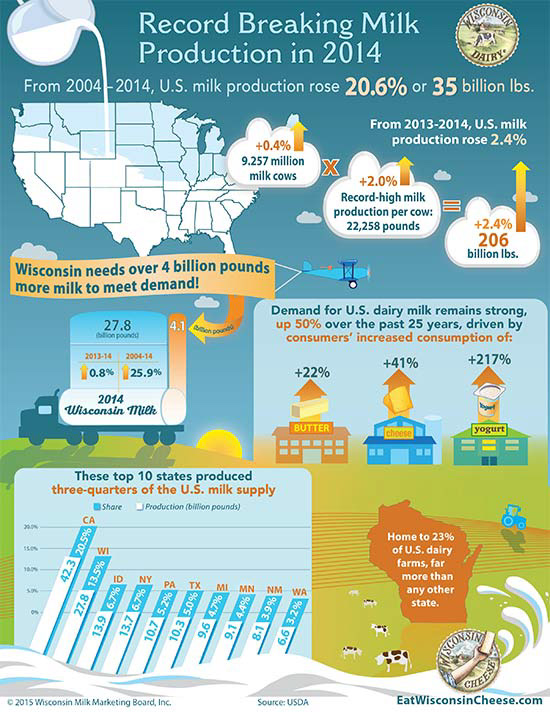
One of my favorite Infographics. These statistics about milk production in 2014 featured fun and light graphics created as an interactive PDF - If you rolled over some of the graphics and text, you were taken to a page with more statistical information.

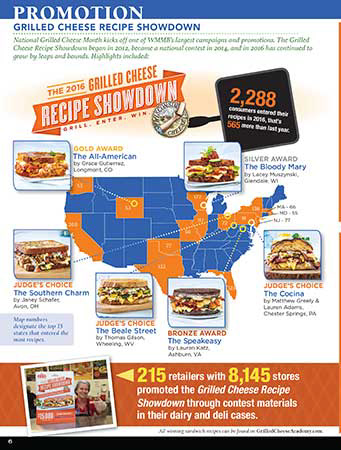
This colorful, letter-sized Infographic was a glossy handout at various County Dairy Promotion Group meetings in Wisconsin that touted the increased success of the June Dairy Month promotion that year.